pibase | pibase step 0 | Filtering
High-throughput Next-Generation Sequencing platforms generate millions to billions of sequencing reads per sample. Such huge data amounts cannot be processed by conventional "exact" methods within a practical period of time (i.e. within hours or days). State-of-the-art fast alignment methods "map" these short reads to a reference sequence without considering indels (insertions, deletions). Some methods work in two stages, re-aligning mapped reads to a local reference sequence window to include short indels ("gapped" mapping).
For the majority of genomic loci, the fast "ungapped" methods work very well, leading to good coverages and clear SNP-calls. In hypervariable regions (e.g. mtDNA control regions) we can observe mapping "noise" (alignment artifacts, see Figure 4) which leads to increased SNP-calling errors. We can also observe noise from sequencing errors and from fast "gapped" mapping methods.
Such noise can be filtered, for example by filtering out sequenced nucleotides with poor quality values, duplicate or near-duplicate sequences, very short sequences, sequences with "too many" mismatches in the alignment, or sequences that cannot be aligned uniquely (because they may match several genomic loci equally well). However, this filtering can change the genotype for some SNP-calls.
Our pibase tools therefore allow the user to consider several filter levels in parallel. If there is no genotype change at a SNP position in any of the filter levels, this SNP-call can be considered "stable". Instable SNPs can either be discarded or filtered for further evaluation, for example using pibase with different filtering settings. For comparisons between samples, sensitivity and specificity can be increased significantly if allele counts at several parallel filter levels are compared, instead of SNP-calls.
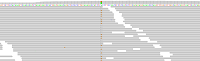
Figure 1 - Ideal Alignments
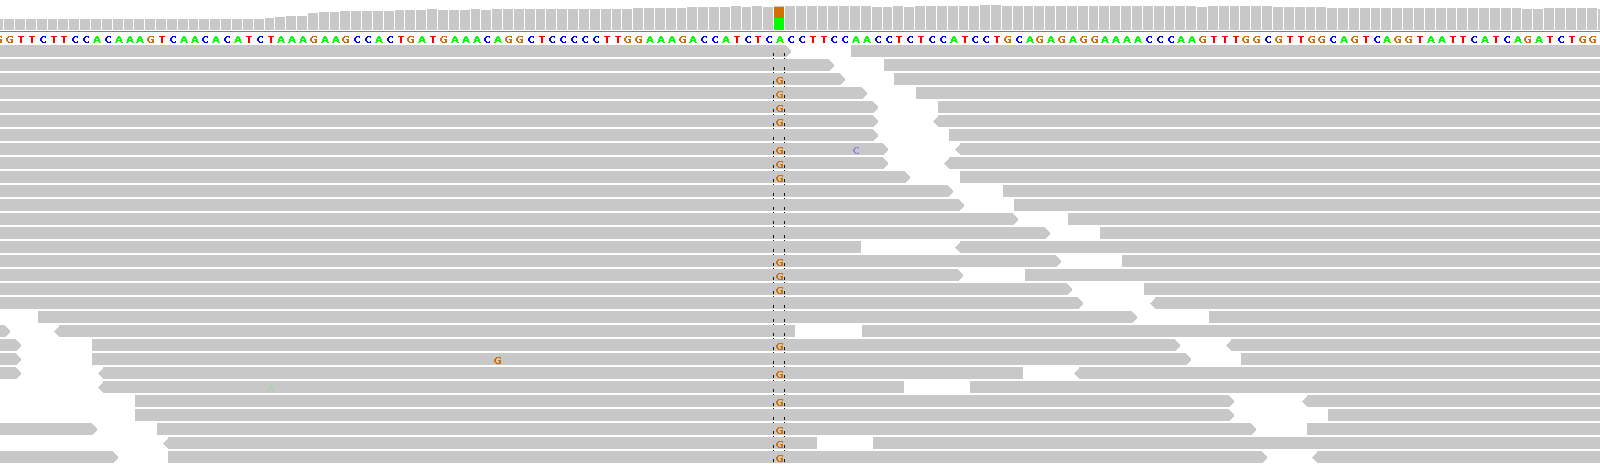
Figure 1 shows alignments generated by BWA from reads generated by the Illumina HiSeq 2000 platform (ICMB, internal project), and displayed in IGV. Each read is represented by a pointed rectangle indicating whether the read was sequenced from the forward or the reverse strand. Mismatches with respect to the reference sequence are shown as a FASTA base within the read.
Figure 1 clearly shows a heterozygous SNP (A/G) supported by reads from the forward and reverse strands. There is practically no "noise" in the aligned reads (just a single "G" and a single "C"). Some reads are shorter than others, which is due to the BWA "mapping" algorithm which allows optional "sequence clipping".
On average in the human genome, one SNP per roughly 1000 base positions is expected, and one deletion or insertion per roughly 6,000-10,000 base positions (see Forster et al). On average, therefore, zero to one mismatches per read are expected, for read lengths of up to 1000 nucleotides. For loci such as in Figure 1, mapping and subsequent SNP typing are plain sailing. Fortunately, such loci such are quite common, allowing an overwhelming harvest of high-quality SNP-calls.
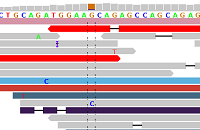
Figure 2 - Indel Artifacts
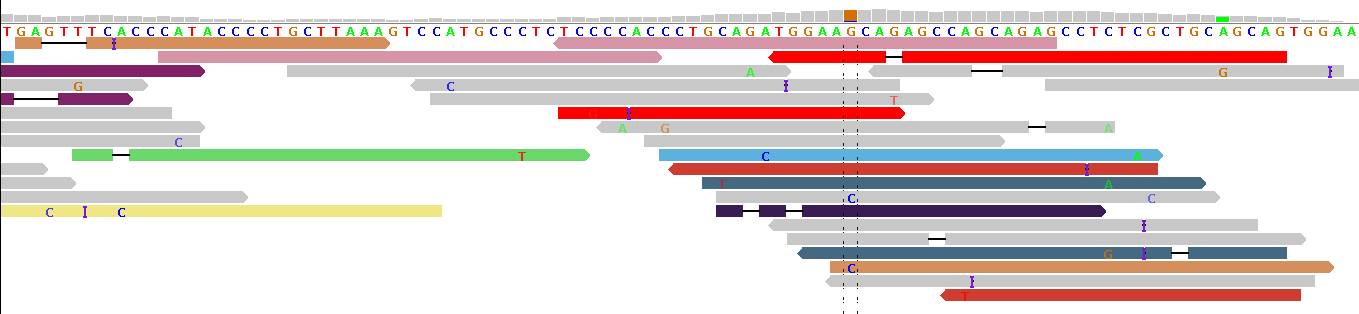
Figure 2 shows alignments generated by BFAST from reads generated by the ABI SOLiD v3 platform (see our example data download, the publicly available 1000-Genomes-Project example BAM file NA12878.chrom22.SOLID.bfast.CEU.high_coverage.20100125.bam, chr22:31491236-31491354 in hg19 coordinates).
In this alignment example, aggressive mapping was permitted, forcing reads onto the reference genome and generating artificial deletions ("-") and insertions ("I"). Because there is no common pattern of indels at a single position, these indels are most probably alignment artifacts (this impression is strengthened when the BWA and SSAHA alignments of the same HapMap individual are displayed in IGV). We commonly see such alignment artifacts in gapped short read alignments, with the notable exception of BWA alignments. For this reason, at pibase filter level 0, we filter out reads with indels before typing a SNP. (If there is a concentration of filtered-out reads, this can be an indication for an indel in the vicinity of the putative SNP, esp. if BWA was used.)
Note that figure 2 shows reads in different colors. In IGV, reads are not gray if a pair of reads has been sequenced, and the partner of this read has been mapped onto a different chromosome. In some cases this relates to a translocation, in other cases to a wetlab issue. In figure 2, the lack of consistent coloring indicates a wetlab issue: probably the fragment concentration during the circularization stage was too high, leading to ligation of some neighboring fragments with each other, rather than circularization of the individual fragments. This is no big issue here, except that (in other loci) the mate pair information cannot be used to refine the alignments (advantageous in some genomic repeat regions).
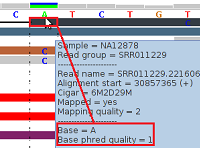
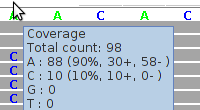
Figure 3 - Low Phred-Like Base Quality
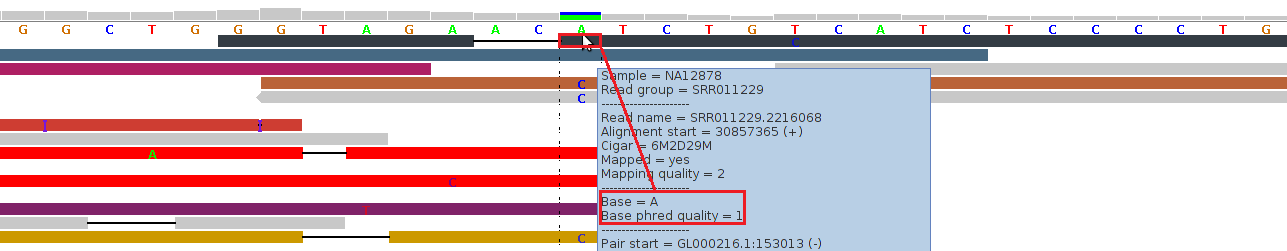
Figure 3 shows alignments generated by BFAST from reads generated by an (older) ABI SOLiD v3 platform (see our example data download, the 1000-Genomes-Project example BAM file NA12878.chrom22.SOLID.bfast.CEU.high_coverage.20100125.bam, chr22:30857353-30857392 in hg19 coordinates).
For the topmost read (black), the tool tip window displays a "Base = A" and a "Base phred quality = 1". The latter is in fact a Phred-like quality value for the base A, which was either calculated by the sequencing machine or by a post-sequencing tool. A Phred-like quality value of 1 strictly means an 80% probability of this base-call being wrong. By default, at pibase filter level 1, we filter out base-calls if their quality value is below 20 (corresponding to an error probability of 1%).
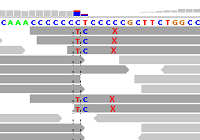
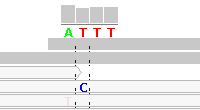
Figure 4 - Reference Sequence Artifact
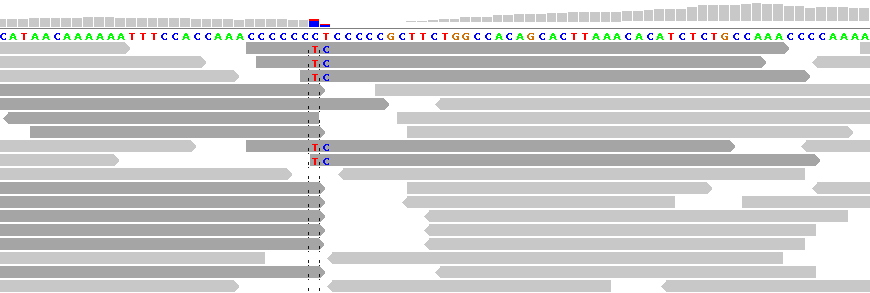
Figure 4 shows alignments generated by Bioscope v1.2.1 (using the ungapped option) from reads generated by the ABI SOLiD v4 platform (ICMB, internal project). As in Figure 1, there is practically no "noise" in the aligned reads. The notable exception is under the "T" between the homopolymeric "C"-stretches. In this region nearly all reads are clipped, with the exception of five reads, each of which show two adjacent SNPs.
These double SNPs are reference sequence-related artifacts resulting from a "missing" C in the second C-stretch, which the ungapped mapping option cannot rectify except by clipping the read. (As a matter of interest, the gapped mapping option with default settings smurged the SNP across two base positions and was generally more "noisy" than the ungapped option.)
Long reads are better than short reads at reaching into low complexity regions such as homopolymeric runs and short tandem repeats, whilst finding an "anchor" in high complexity regions. For this reason, we also apply a read length filter level.
In this example, it is also necessary to filter out the reads with two mismatches in order to get the correct genotype.
Figure 5 - Mapping Artifacts In Low Complexity Region
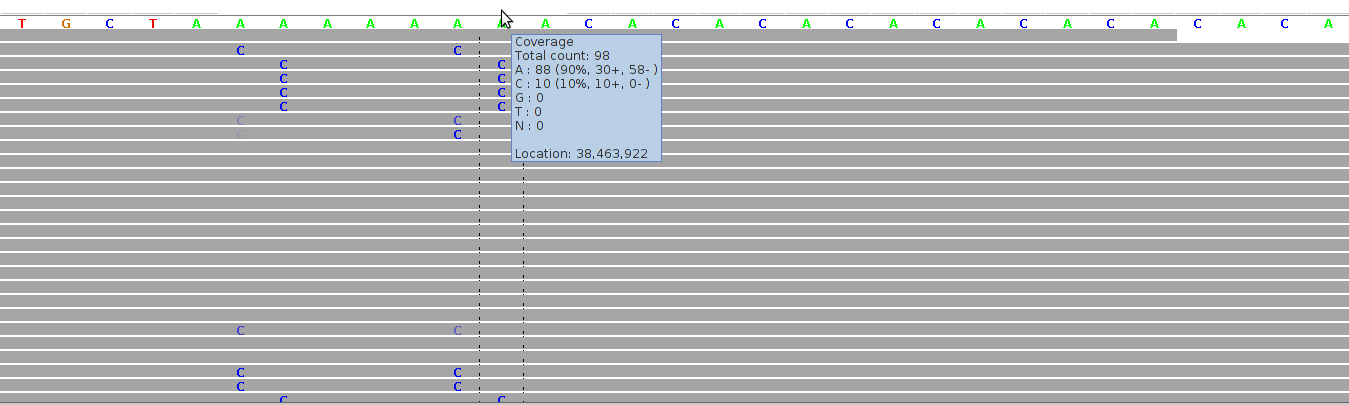
Figure 5 shows alignments for a region comprising a homopolymeric "A"-stretch bordering on a short tandem repeats ("CA"-repeats). The alignments were generated by Bioscope v1.2.1 (using the ungapped option) from reads generated by the ABI SOLiD v4 platform (ICMB, internal project).
The cluster of "C" mismatches is a symptom of mapping artifacts which can be filtered away by considering only both-stranded confirmation, by filtering away short reads, and by filtering away reads with more than one mismatch.
Figure 6 - Mapping Artifacts From Randomly Mapped Unmappable Reads
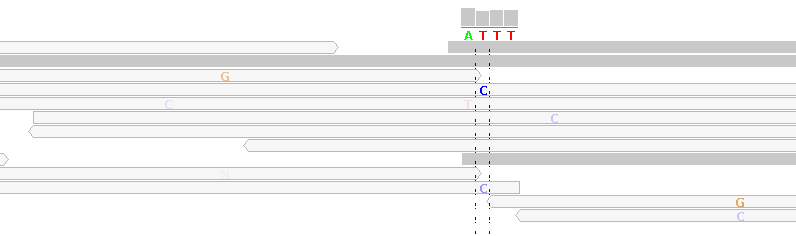
Figure 6 shows alignments generated by BWA from reads generated by the Illumina HiSeq 2000 platform (ICMB, internal project, most of the reference sequence has been removed for anonymization reasons).
The light gray reads show mismatches, e.g. "C" in the column under the reference sequence base "T". These light gray reads are "randomly mapped" reads which map equally well to other locations in the reference genome. BWA tags these reads with a mapping-quality of 0, indicating up to 100% mapping error probability (the mapping quality score is analogous to the Phred-like base quality score). Here, we have no way of deciding whether this is a C/T SNP, except by considering further NGS sequencing runs of the same sample or by Sanger-sequencing.
By default, in our highest filter level, we filter for a mapping quality score of at least 20 (indicating 1% mapping error probability).
Mapping quality values are indicative and each mapping tool appears to have its own mapping quality score formula. For example, in SOAP files we found just two distinct mapping quality values: 0 (100% mapping error probability) and 30 (0.1% mapping error probability).
^top